Home » Unemployment
Category Archives: Unemployment


Still the same
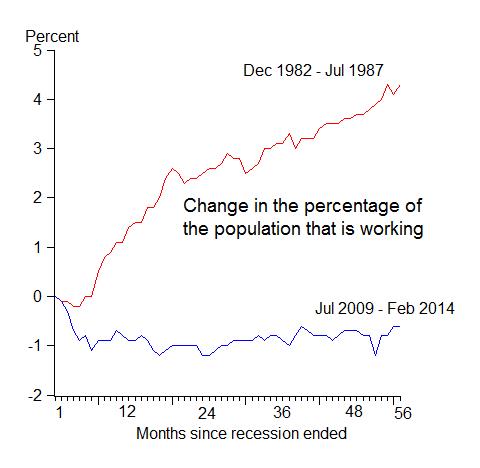
Official unemployment rate has gone down dramatically, but the improvement of labor market has been largely fake, as the employment-population ratio hasn’t moved much since recession ended. See this sharp chart from John Taylor at Stanford.
You can also take a longer term perspective at this ratio below:

Feel puzzled? You can find out the reason why unemployment rate and the employment-population ratio tend to diverge during this reovery here.
The unemployment puzzle
The official unemployment rate has been dropping:

Yet, employment to population ratio shows nothing has really improved:

So what to believe? Is US labor market thawing? Or are we still in a slump?
The official unemployment rate is calculated as the number of unemployed divided by labor force. Let’s use an example to illustrate. An economy has a total labor force of 100; if 10 is unemployed, then the unemployment rate is 10/100=10%.
To understand the issue, we need to appreciate how the labor force is calculated. If 3 out of 10 people who are previously unemployed drop out of labor force, because they are discouraged by not being able to find a job for quite some time, labor force now changes from 100 to 97. And the new unemployment rate is (10-3)/(100-3)=7/97=7.2%. This represents a 2.8% improvement, although the labor market condition has not improved at all.
Is this what’s happening now in the US? If so, it will show up in labor participation rate, which is defined as the ratio between total labor force and adult population. And let’s assume the adult population is 150. When there are discouraged workers giving up and exiting the labor market, labor participation rate drops from 100/150=67% to 97/150=65%.
Not surprisingly, that is what we see in the real data:

Get real perspective on America’s unemployment
Wells Fargo has a nice chart depicting the relationship between real GDP growth and the change of unemployment rate, the so-called Okun’s Law:
[singlepic id=40 w=400 h=300 float=]
The two are negatively correlated. From regressional analysis, for unemployment rate to drop, the minimum real GDP growth rate required, on average, should be 3.4%. But the actual growth rate in 2011 was only 1.6%. So why have we been witnessing a drop of unemployment rate anyway?
The breakdown of this long-run relationship may be due to the drop of participation rate in labor market. The real unemployment rate, taking participation rate into account, should be much higher.
As shown in the graph, the current change of unemployment rate would require a much faster real GDP growth, at roughly 5%, three times of the current growth rate.
What’s wrong with America’s job engine?
A nice video/graphical analysis from WSJ:
US Unemployment Landscape
The Southern states began to catch up, in a bad way: with unemployment rates rising to the similar level of those dire states that were hit hard by housing bubble – this is not good.


Analysis of April Employment Report
John Silvia:
David Rosenberg:
Job Perspective of America’s Lost Decade
I posted a little while ago on America’s lost decade in terms of investment returns (also this post), here below is a nice graph summarizing job creation by decade: The past decade was clearly a lost decade in job creation. Also read my previous post on this here.

Firms with job openings
Percentage of firms with job openings:

(click to enlarge)