Home » Posts tagged 'Unemployment'
Tag Archives: Unemployment


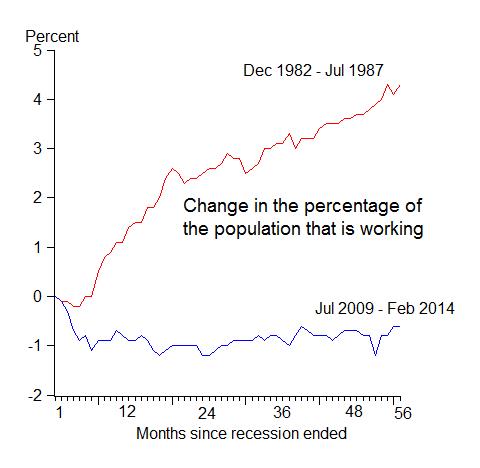
Still the same
Official unemployment rate has gone down dramatically, but the improvement of labor market has been largely fake, as the employment-population ratio hasn’t moved much since recession ended. See this sharp chart from John Taylor at Stanford.
You can also take a longer term perspective at this ratio below:

Feel puzzled? You can find out the reason why unemployment rate and the employment-population ratio tend to diverge during this reovery here.
Why still no robust employment recovery?
Gary Becker summarizes the reasons for the slow job recovery into three categories:
1. The aftermath of a big financial crisis, as explained by the research done by Reinhart and Rogoff;
2. Policy and regulation uncertainties hinder investment, although Corporate America are flooded with cash;
3. Relatively more generous unemployment benefits offer no immediate incentives for job seeking, keeping a non-negligible proportion of population out of labor force.

(graph courtesy of Calculated Risk)
The unemployment puzzle
The official unemployment rate has been dropping:

Yet, employment to population ratio shows nothing has really improved:

So what to believe? Is US labor market thawing? Or are we still in a slump?
The official unemployment rate is calculated as the number of unemployed divided by labor force. Let’s use an example to illustrate. An economy has a total labor force of 100; if 10 is unemployed, then the unemployment rate is 10/100=10%.
To understand the issue, we need to appreciate how the labor force is calculated. If 3 out of 10 people who are previously unemployed drop out of labor force, because they are discouraged by not being able to find a job for quite some time, labor force now changes from 100 to 97. And the new unemployment rate is (10-3)/(100-3)=7/97=7.2%. This represents a 2.8% improvement, although the labor market condition has not improved at all.
Is this what’s happening now in the US? If so, it will show up in labor participation rate, which is defined as the ratio between total labor force and adult population. And let’s assume the adult population is 150. When there are discouraged workers giving up and exiting the labor market, labor participation rate drops from 100/150=67% to 97/150=65%.
Not surprisingly, that is what we see in the real data:

What’s wrong with America’s job engine?
A nice video/graphical analysis from WSJ:
America’s Lost Decade, part 4
This is a post following my previous posts on the same topic, see p1, p2, p3.
When discussing the issue, most people focus on GDP growth. Yes, in terms of GDP growth, in the past decade, the US still managed to grow 18%, cumulatively – that’s roughly 1.8 percent per year on average. However, in terms of employment growth, it has been a lost decade for the US (see the chart below).

(click to enlarge)
Given the economic dynamism in the US, and compare it to Japan, I have long thought the Lost Decade would never happen in America, a land full of opportunities.
I guess I need to re-visit my presumptions — Whether a big housing bubble (in the US’ case, two big bubbles in one decade) always foretells anemic economic growth afterward, as opposed to the common belief that Japan’s lost decade was largely due to policy mistakes. Maybe, in the aftermath of a big bubble, America and Japan are really not that much different – an open question.
Youth Unemployment
Daniel Henninger wrote on WSJ editorial page that the youth unemployment in the US is rising, now at 20%. He is worried about the US becoming another Europe, where welfare state creates a shortage of private-sector jobs.
Unemployment today doesn’t look like any unemployment in the recent American experience. We have the astonishing and dispiriting new reality that the “long-term jobless”—people out of work more than six months (27 weeks)—was about 44% of all people unemployed in February. A year ago that number was 24.6%.
This is not normal joblessness. As The Wall Street Journal reported in January, even when the recovery comes, some jobs will never return.
But the aspect of this mess I find more disturbing is the numbers around what economists call “youth unemployment.” The U.S. unemployment rate for workers under 25 years old is about 20%.
“Youth unemployment” isn’t just a descriptor used by the Bureau of Labor Statistics. It’s virtually an entire field of study in the economics profession. That’s because in Europe, “youth unemployment” has become part of
3 reasons why we’ll have another jobless recovery
Paul Kasriel, Chief economist of Northern Trust, explains in this interview piece why labor market will take very long time to recover. Very sensible analysis.

(click on the image to play)
Job market is improving, but still…
US labor market has started to add jobs at a pace not seen since 2007 (see chart below, graph courtesy of Northern Trust). This is positive.

Highlights of job losses/gains in March:
Construction: +15,000 vs. -59,000 in February
Manufacturing: +17,000 vs. +6,000 in February
Private sector service employment: +82,000 vs. +15,000 in February
Retail employment: +14,900 vs. +8,000 in February
Professional and business services: +11,000 vs. +40,000 in February
Temporary help: +40,200 vs. +36,700 in February
Financial activities: -21,000 vs. -15,000 in February
Health care employment: +26,800 vs. +14,100 in February
But still (pretty much) this will be a jobless recovery (see the scary chart below), following the last two recessions (1990-91, and 2001).

(click to enlarge; graph courtesy of calculatedrisk)
Tough road ahead…