A closer look at China’s inflation number
Today, China’s CPI number in May came out lower than last month, declining from April’s 8.5% to 7.7%. Here is a closer look at China’s inflation number with trends from 2007.
CPI food component is still too high and it has been hoovering around 20% since early 2008. Be reminded food consumption in China accounts for almost 30% of personal consumption expenditure. The most recent food inflation number reads at 19.9% (see chart below).
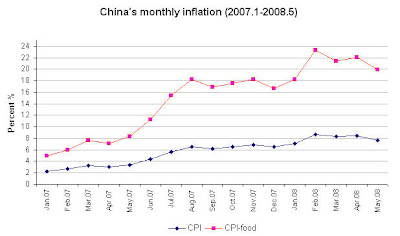
(click to enlarge; source: NBS China and author’s own calculation)
If you multiply food inflation, 20%, by food consumption weight 30%, you get food’s contribution to overall inflation: 6% alone. How come the overall inflation is only at 7.7%, without even counting other big components?
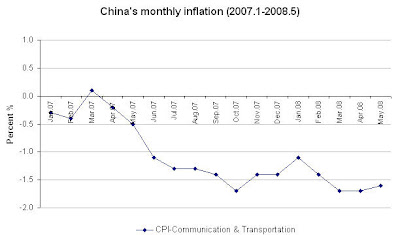
My guess is that government’s subsidy in gasoline makes the overall inflation look much more benign than it actually would be, if letting the market sets the price. The communication and transportation component of inflation actually has been experiencing a deflation (see chart below).
Well, aren’t we having an oil shock in the world right now?
China’s monetary policy still not tight
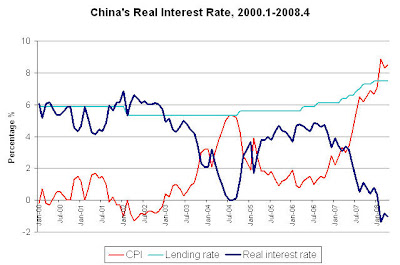
China’s real interest rate (interest rate minus inflation) is still negative (see chart below), despite the multiple increases of bank reserve ratio recently.
(click to enlarge; source: EIU, author’s own calculation)
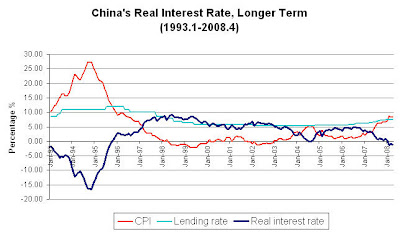
To fight inflation and not to repeat the “great inflation” (leading to deflation later, the hard landing scenario) in mid-90s (see chart below), China’s policy makers need to raise interest rate quickly. And this should be done sooner than later when inflation rate is still below double digit. The temptation to allow for inflation to go even higher in order to accommodate economic growth (the so called “go-stop” policy) is dangerous and should best be avoided.
(click to enlarge; source: EIU, author’s own calculation)
Richard Berner interview
Disproportional impact of oil
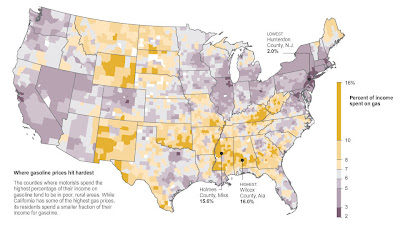
The impact of high oil price is being felt disproportionally across the country. In the rural area, where most people drive pick-ups, and in the South, where people are poorer and no public transportation is available. More on NYT article, “Rural U.S. Takes Worst Hit as Gas Tops $4 Average“.
(click to enlarge; courtesy of NYT)
Perfect recession indicator
YoY change of employment is my favorite recession indicator. Floyd Norris on NYT explains his recession indicator with perfect record (like all labor markets indictors, this is a lagging indicator):
One unfortunate milestone reached today was that the 12-month change in private sector jobs, before seasonal adjustment, is down 125,000 jobs. (After seasonal adjustment, there is a small increase, for some reason.)
Over the last nine recessions, dating back to 1953, that indicator has a perfect record. Every time it has turned negative, the economy is already in recession. And once it turns negative, it stays that way for quite a while. (Caution: These numbers will be revised, and this history is based on the revised figures, not the originally reported ones. But I think the revisions, when they come, are much more likely to indicate the figure went negative early rather than later.)
In December 1953, the figure turned negative six months after the recession was later determined to have begun. It remained negative for 14 months.
In October 1957, it went negative three months after the recession began, and stayed that way for 15 months.
In December 1960, the negative jobs figure came 9 months after the recession started, and it stayed negative for 10 months.
In July 1970, it turned negative 8 months after the recession began, and stayed negative for 13 months.
In November 1974, the first negative number came a year into the recession. It stayed negative for 14 months.
In June 1980, the recession was 6 months old when the negative number arrived. It stayed negative for just 6 months.
In January 1982, the negative number came 7 months after the recession started, and it stayed negative for 17 months.
In December 1990, the first negative number came 6 months into the recession, and the figure stayed negative for 17 months.
In June 2001, the recession was 4 months old. The job change number stayed negative for 30 months, the longest streak ever.
During that stretch, the figure never went negative without a recession being under way. That is not a complete coincidence, of course, since the employment figures are one factor the National Bureau of Economic Research weighs in setting recession dates.
In every case, the recession was over before the job change figure turned up. Perhaps it is interesting that the lag between the official recession end and the first 12-month increase in private sector jobs was significantly longer than in earlier recessions. The lag was one year after the recession ended in March 1991, and two years after the most recent recession ended in November 2001.
If we assume that this year falls within the previous parameters, then the recession started sometime between May 2007 and March 2008, with October 2007 the most likely. Based on other data, October is probably the earliest date that the recession could have begun.
Again assuming the previous data is predictive, the last negative job number will arrive between November 2008 and November 2010, with August 2009 the most likely month.
What if Trichet truly admires Volcker?
Are we going to see a rate policy divergence between the Fed and ECB? For much of the first half of 2008, investors have been talking that ECB sooner or later will cut rates to follow the steps of the Fed.
But maybe one fact was neglected. Unlike the Fed’s dual mandate, ECB has the single mandate of fighting inflation. This makes sense especially when I consider: What if President Trichet is a truly admirer of Paul Volcker, a.k.a inflation fighter to bring down inflation no matter what?
Will dollar’s further downfall and the possibility that Gulf countries unpeg dollar eventually pressure Bernanke to adopt similar policy stance? Let’s wait and see.
But bear in mind, monetary policy 101, something we have learned in the past several decades, tells us maintaining price stability is the No. 1 priority for the central banks. Yes, no matter what.
Time to declare: Oil Shock 2008
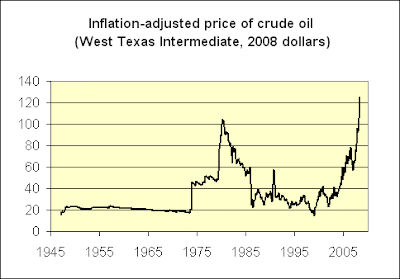
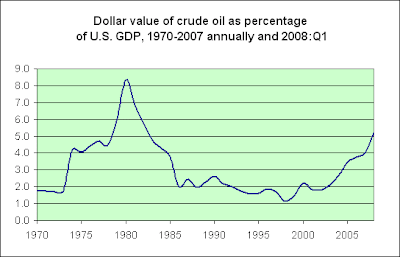
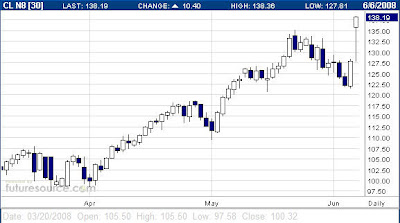
Today is the high time to declare we are officially in oil shock of 2008, beating 70s in prices, but not in terms of the hit to the economy. Nonetheless, nobody should feel complacent about it.
Jim Hamilton has these two graphs to share:
Oil crises in 70s made the economy today less reliant on oil, but don’t take it for granted.


