

Economics of holiday gift-giving
A survey of leading economists on the following statement:
Giving specific presents as holiday gifts is inefficient,because recipients could satisfy their preferences much better with cash.
Are we prepared for the next financial crisis?
A discussion at Chicago Booth:
Will richer Chinese want to get freer?
60 minutues interview with Chinese billionaire Zhang Xin.

I tend to think economic freedom is a necessary condition for political freedom, but not a sufficient condition. On this, I agree with Milton Friedman.
The corollary of above statement is poor countries can’t really have robust democracy. Just look at India.
Grantham: whipping the donkey
The latest Jeremy Gratham interview, with Charlie Rose. In this 50-min video interview, Jeremy talks about China and world’s energy price; his interesting experience with asset bubbles in the past (a frequent topic, but still refreshing), and his forecast of the US economic growth and stock market.
My favorite part is he analogized Fed’s monetary policy as whipping a donkey, trying to make the economy run faster like a race horse. 🙂 Quite accurate.
China is leveraging up
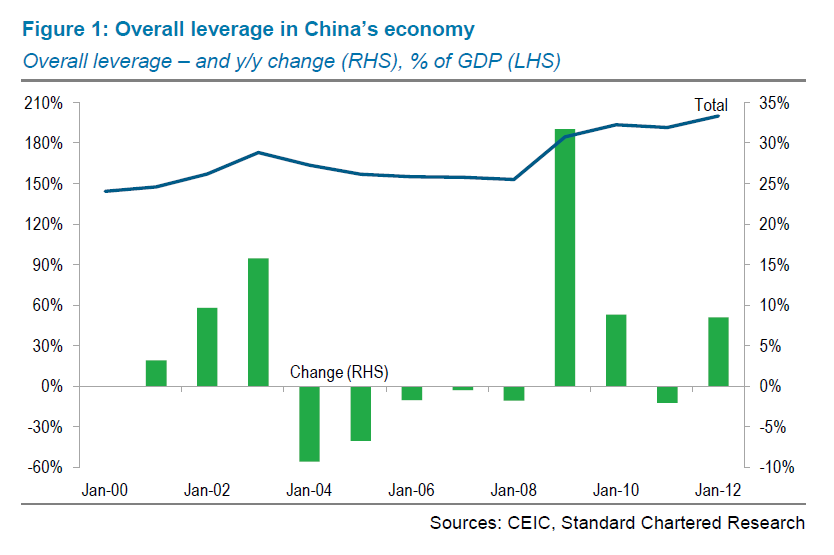
While the rest of the world is going through a deleveraging process, China has been leveraging up. Its economy is getting bubbly.
According to research by Standard Chartered Bank, China’s overall leverage ratio (the sum of the leverage of government, corporate and household) now reached 210% of GDP, rising from a rather high level 150% of GDP in early 2000s.
Dividing the overall leverage ratio in into three sub-components, we see the biggest increase came from the corporate sector: the ratio in that sector has increased from 80% of GDP at the beginning of the Great Recession to around 130% of GDP today.
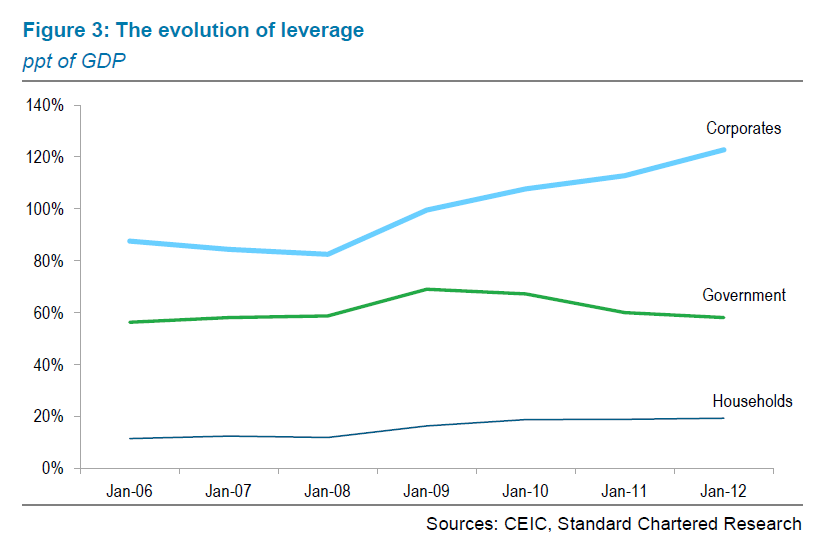
Most of the leveraged-up corporations are SOEs. They are the natural candidates to respond quickly to government’s call for stimulus spending in the aftermath of the financial crisis during 2007-2009.
Besides SOEs, local governments also created all sorts of firms outside of government’s (and bank’s) balance sheet, the so-called local-government-investment-vehicles, or LGIVs. This is Chinese version of shadow banking system. My sense is that they have contributed a great deal to China’s housing bubble.
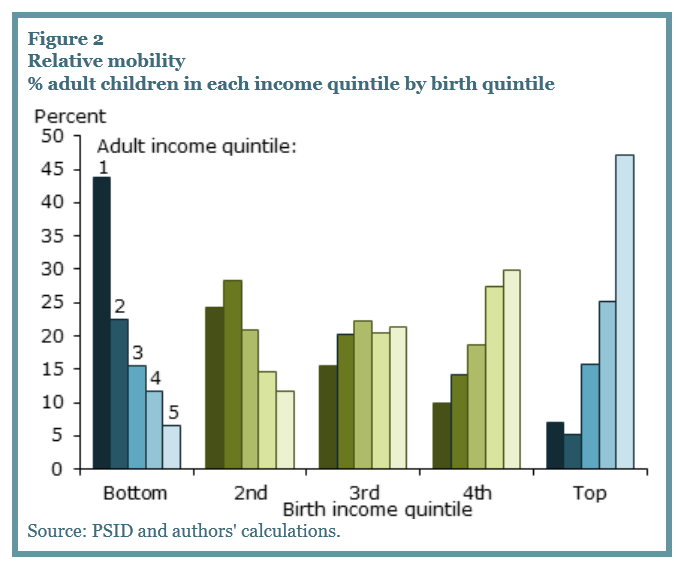
American Dream revisited
American Dream is all about upward mobility. But it depends on how you define income mobility.
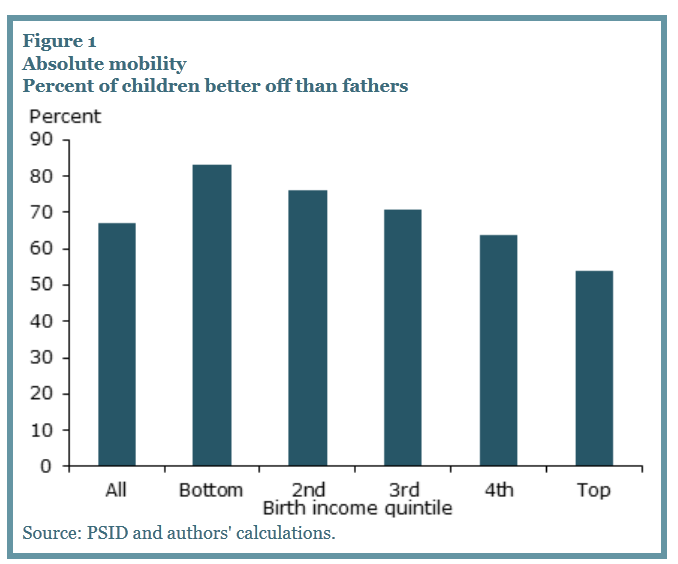
According to the recent research by San Francisco Fed, America is indeed very mobile when mobility is defined by absolute mobility: each generation achieves a higher economic status than the prior generation. But if mobility is measured by relative mobility, the extent to which individuals can change rank in the income distribution relative to their parents, America is much less mobile.
Two graphs to illustrate the story (graph courtesy of SF Fed):
-absolute mobility
-relative mobility
fools, and greater fools
’60 minutes’ investigates the recent development of Chinese housing bubble in the following video.
Following my previous posts (here, here, here, here and here) on China’s housing bubble, I am now re-organizing my thoughts, and starting to work out a formal economic analysis on China’s housing bubble.
Specifically, I will address the question if the current housing price in China can be justified by the story of China’s fast economic growth coupled with her fast industrialization and urbanization. My initial analysis clearly says no. I call this a ‘fools-and-greater-fools’ theory. In history, great bubbles always came with even greater stories. China is no exception.
Will keep you guys posted.
US economic growth for the last 200 years
The below graph shows the average growth rate by decade in the US since 1790. The recent decade, 2000-2009, ranks the bottom 2nd. The only worse decade was 1930s. This helps to put a lot of things into perspective.
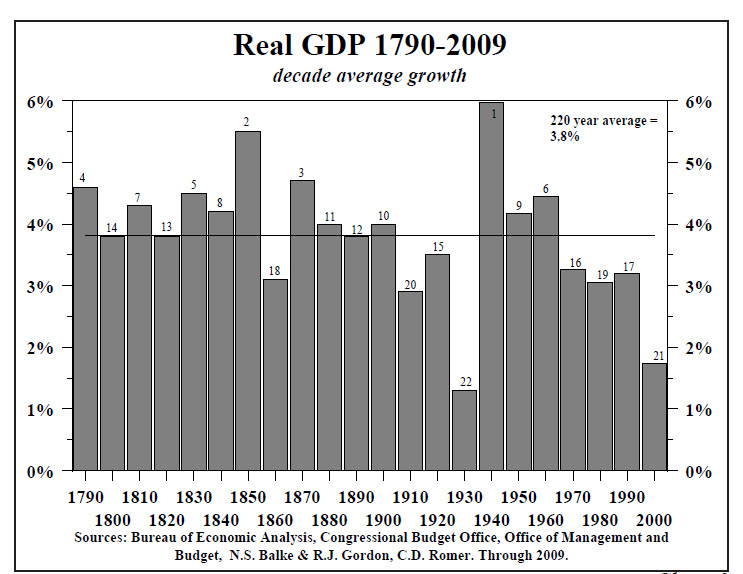
(Note: the small number on the bar indicates the ranking; graph courtesy of Hoisington Investment Management)