Home » 2009 (Page 38)
Yearly Archives: 2009


Graduating is not fun in 2009
This week is the graduation week all cross the country. Graduating in 2009 is not fun: with unemployment rate rising to 8.9% and surely going to get worse in coming quarters, the job is harder to find than ever. Even you find a job, your wage/salary is likely to be much lower than in good times. And according to the research by Yale economist Lisa Kahn, this initial gap in salary tends to persist over many years to come.
The graph below shows that when unemployment rate is at 7.1%, the initial salary offer is more than 10% lower than when the unemployment rate is at 5.3%. When the unemployment rate is at 9.6%, the initial offer, on average, is more than 30% lower than in good times.
Worse yet, the gap does not dissapear and it tends to perist for a long period of time. As shown in the graph, even after 15 years, the gap is still at 10% for people hired when unemployment rate is at historically high level. Call it “the curse of class of 2009“.

(click to enlarge; source: WSJ)
Now with some positive note from Andy Rooney at 60 mins, “graduations are not what’s wrong with the world”:
Geithner Sucks and Pass/Pass*
A hilarious video on bank stress test.
WSJ reports how some banks battled with the government and managed to force government to make concessions and lower the capital requirement.
Here are some interesting excerpts:
At times, frustrations boiled over. Negotiations with Wells Fargo, where Chairman Richard Kovacevich had publicly derided the stress tests as “asinine,” were particularly heated, according to people familiar with the matter. Government officials worried San Francisco-based Wells might file a lawsuit contesting the Fed’s findings.
…
Wells Fargo’s capital hole shrank to $13.7 billion, according to people familiar with the matter. Before adjusting for first-quarter results and other factors, the figure was $17.3 billion, according to a federal document.
…
Citigroup’s capital shortfall was initially pegged at roughly $35 billion, according to people familiar with the matter. The ultimate number was $5.5 billion. Executives persuaded the Fed to include the future capital-boosting impacts of pending transactions.
…
Bank of America’s final gap was $33.9 billion, down from an earlier estimate of more than $50 billion, according to a person familiar with the negotiations.
And government used tier 1 capital ratio instead of TCE ratio to measure capital adequacy.
![[Chart]](https://s.wsj.net/public/resources/images/P1-AP851_STRESS_NS_20090508232418.gif)
Conundrum in bond yields
The Fed is in a uncharted territory trying to buy long-term bonds with objectives to lower inflation expectations and government financing cost. Can it succeed? Or are we going to see an inevitable rise of government bond yields (steepen yield curve)? And mortgage rates will also have to go up again suffocating the slight chance of housing market recovery?
Read the analysis from Wall Street Journal.
China’s export-driven growth exaggerated
China has long been thought as export driven and heavily trade dependent. In my previous post, I told the story that China’s trade sector, if measured by value added, only accounts for less than 10% of GDP and the importance of trade is overly exaggerated. Also, according to Albert Kiedel at Carnegie Endowment, China’s GDP growth is almost independent of US GDP fluctuations (see the chart below).

Now I made another interesting graph using the data from National Bureau of Statistics (NBS): the growth component of China’s GDP growth— how investment, consumption and export have contributed China’s GDP growth historically.
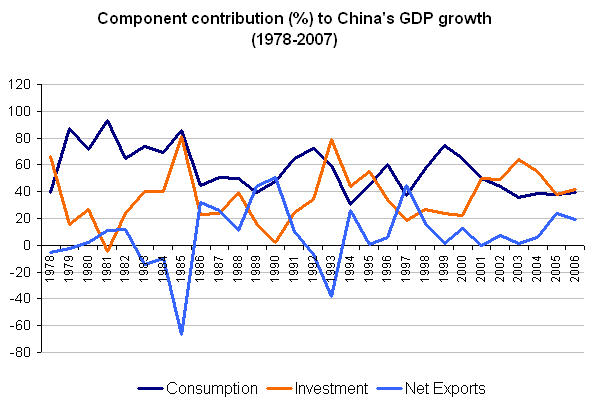
(click to enlarge; source: my own calculation and NBS)
As you can see from the above graph, domestic consumption and investment have played a much larger role than net exports. In recent years, net exports’ contribution to GDP growth was only around 20% of the total. (note: the investment includes both private investment and government investment. I have to point out part of investment is surely export-related and the graph above does not capture the potential linkage between export and domestic investment. I will dig more in the future to find out). But in any case, I tend to think of China as a large open-economy (in the case of open trade and FDI, not in the sense of capital control), similar to the US. Although trade plays a very important role in China, but because the country is so large that even trade was hard hit the economy can still manage to grow at a relatively fast speed. And don’t forget China is still a relatively poor developing country; for poorer countries, faster growth came as no surprise because the strong catch-up effect often dominates.
Eating time and obesity
This interesting graph seems to show that there is a negative correlation between how much time you spend on eating and obesity.

(click to enlarge; source: NYT)
Less time spent on eating could mean people eat more fast food, which tend to be less healthy. Slow eating also helps you digest better, possibly preventing building up fat.
New Zealanders seem to be an outlier in the graph. This could be they eat too much dairy food.
Employment Snapback?
Milton Friedmans’ monetary model and his famous line that “inflation is always and everywhere a monetary phenomenon” are known to many people, but one another hypothesis from Milton on business cycle rarely caught people’s attention.
The so called “plucking model” hypothesizes that the farther you pull it (the economy), the more forcefully it snaps back. Translated into plain English and apply it to business cycle theory, it indicates the sharper the economic downturn, the faster the recovery will be (a.k.a., V-shaped recovery).
The recent empirical research seems to validate such view. And we also tend to observe such pattern in employment recoveries in the pass recessions (see picture below).

(click to enlarge; graph courtesy of calculatedrisk)
Many people argue (e.g. Paul Krugman) that the unemployment in this recession will probably follow the pattern in 1991 and 2001 recessions, i.e. the employment recovers in a very slow pace, leading to the so-called jobless recovery. But if we look at the graph above carefully, the job losses in 1991 and 2001 recessions were also two of the shallowest. So does this indirectly validate Friedman’s view: the less severe the economic downturn, the slower the employment recovers??? Vice versa?
Anyway, if Friedman’s “plucking” hypothesis were true, we are likely to see both investment and employment come back pretty quickly this time around.
(A word of caution: Every recession is different. Given the uniqueness of the great deleveraging and how hard the financial sector was hit in this recession, I am still skeptical that a quick V-recovery is the likely scenario. But I am open minded. I certainly hope I was wrong. )
One last word: these days, we are filled with all kinds of alphabetical predictions: V, W, U, or L, you name it. Now sounds if we haven’t had enough, Jeremy Grantham of GMO, in his most recent investment newsletter, came out another possible scenario: the VL-shaped recovery, i.e., a V-recovery initially then the economy falls back to a long anemic growth path, which he calls Very Long (VL) Recovery. It’s quite an interesting analysis. You can read his newsletter here.
Gender discrimination in workplace
I can hardly see how the gender wage gap can be explained by differences in productivity levels. The only conclusion is gender discrimination still exists in today’s workplace. The positive news is the gap has been shrinking: in 1980, the gap between male and female was 36%; in most recent 2008 data, the gap reduced to 20%.
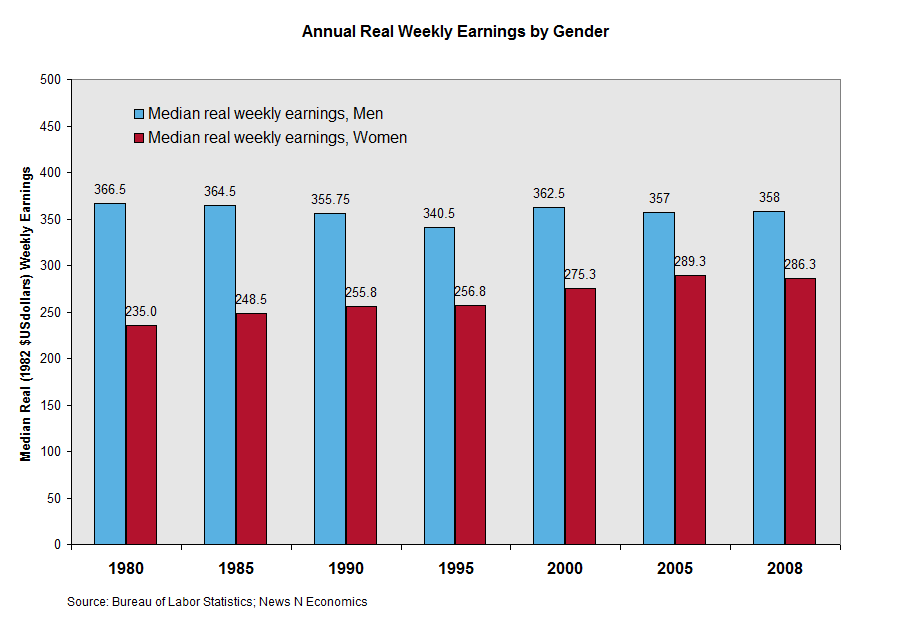
(click to enlarge; source: News N Economics)
B- for stress test
Wall Street Journal gave a B minus to government-led stress test on major banks:
The government's bank stress tests deserve a B-minus.
To give a sustained boost to investor confidence, the tests needed demonstrable rigor. They achieved that up to a point. While worst-case loss rates look tough, certain loan portfolios — in particular commercial real estate — at some banks seem to have gotten off lightly. Meanwhile, the tests' numbers for underlying earnings — which are needed to offset soaring credit losses — could turn out to be optimistic in some cases.
It is hard to quibble with most of the government's worst-case loss rates, which are calculated for this year and next. For example, an 8.8% loss rate for first-lien mortgages seems suitably tough, even when taking into account the aggressive underwriting during the housing bubble. The government's 13.8% worst-case loss-rate for second-lien mortgages seems fair. But it is a stretch to think Wells Fargo, with its large home-equity book focused on stressed housing markets, will have a lower-than-sector loss rate of 13.2%.
![[Timothy Geithner]](https://s.wsj.net/public/resources/images/MI-AW603_Stress_NS_20090507184435.gif)
The government may have been too optimistic in positing an 8.5% commercial-real-estate loss rate. This sector is just starting to fall apart, and defaults may move sharply higher as borrowers struggle to refinance loans. BB&T's commercial-real-estate worst case is higher at 12.6%, but its portfolio may arguably show higher losses.
The government's earnings projections also need to be taken with a pinch of salt. It is optimistic to assume banks can repeat their first-quarter revenue generation, for instance. Given the Fed has unleashed a tidal wave of liquidity into the system, interest rates are going to be extremely volatile for several quarters, making bank revenue very hard to predict.
Another reason to be skeptical is few banks have to substantially increase overall levels of Tier 1 capital, which includes common and preferred shares, by raising new money. The government is effectively saying most large banks were solidly capitalized even when investors fled earlier this year.
Instead of immediately raising overall capital levels, some banks are just shifting the mix toward common equity — the highest-quality capital. Lenders that need to raise fresh money include GMAC, General Motors' lending arm. Also, Wells Fargo's offering of common stock, announced Thursday, suggests its overall capital will increase.
Finally, the government has effectively said it wants banks to have Tier 1 common stock equivalent to 4% of risk-weighted assets. First, investors have to decide whether they have confidence in the risk weightings.
Second, Tier-1 measures of capital leave out certain unrealized losses on securities that could become real later — something captured by tangible-common-equity ratios.
Then they must decide whether 4% — which still translates into 25-to-1 leverage — is safe for the unpredictable environment we are in.