How good is economic growth and stock market correlated in China?
The Chinese A share market has been a better indicator of China’s economic fundamentals since the second half of 2005, thanks to the non-tradable share reform and growing composition of institutional investors.

Do Private Equity Firms "Create Value"?
A NBER digest commentary (author: Laurent Belsie) looking at the following research: Do Private Equity Firms “Create Value”?
” Private equity owned companies use much stronger incentives for their top executives and have substantially higher debt levels … (but there is) little evidence that (they)…outperform public firms in profitability or operational efficiency.”

A central tenet of PE investors is that they fix companies by improving their management. A major method for accomplishing this is through managers’ compensation: lower salaries than their counterparts in public corporations, but bigger equity stakes in their company. The idea is that by tying compensation more closely to corporate performance, these managers will make the tough but needed changes. That theory doesn’t always work out in practice, though.
Leslie and Oyer examine 233 U.S. companies that either underwent a leveraged buyout (LBO) between 1996 and 2004 and then completed an initial public offering (IPO) before the end of 2005 or went private between 1998 and October 2007 (and about which there is compensation data available). They supplement that data with interviews of half a dozen experienced executives at private equity firms. They find that since 1996 the highest paid executive in a privately owned firm earned about 12 percent less salary, but got 3.3 percentage points more company equity and 12.6 percent more of his cash compensation through bonuses and other variable pay, than the CEO of a public corporation. And, they claim that it’s not just the CEO who got this treatment: the 20 to 80 top managers typically also got significant equity in the company.
“A very important aspect of the equity programs is that managers are required to contribute capital — managers purchase the equity with their own personal funds,” they write. They say that their study is the first to document the changes in management incentives in private buyouts since 1990, when the PE landscape was far different. The impact of these incentives is less clear, however. “While the incentives given to PE-owned firms’ managers keep their companies operating at average levels of profitability and efficiency, we do not find evidence that they create significant excess profits,” the authors conclude. In only one category they measured – sales per employee – did private-equity ownership have a significant positive effect. Even that effect dissipated in a few years once the company went back to being a public corporation.
Indeed, the high debt levels and pay structure under private equity management also tended to disappear in one to two years after the firm reverted back to a public company, the study finds. Petco, the pet-supplies chain, illustrates the cycle. When it was a public company between 1995 and 1999, Petco’s CEO Bruce Devine owned about 2 percent of the stock. After he took the company private in 2000, his share rose to about 10 percent. When the company went through an IPO in 2002, his share of the company fell immediately to 7 percent. By 2006, when he was chairman but no longer CEO, his share had fallen to 4 percent. The chain’s debt-to-asset ratio tripled after it went private but began to fall back toward pre-2002 levels once it was public again.
The authors concede that their sample is limited because, in most cases, private-equity firms don’t have to report compensation practices. Thus, the sample represents a minority of the private-equity universe: 144 companies that did publish compensation data as part of a reverse LBO (where the private equity owners sell out in an initial public offering). But the authors find no reason that managerial incentives at firms with an LBO should be different from others owned by private-equity firms. The authors control for the other concern — that their sample might be skewed because private-equity firms target companies with already high managerial incentives – by looking at the characteristics of 89 other U.S. firms that were attractive to private equity firms but not yet owned by them.
Although papers published in 1989 and 1990 documented differences in the share of CEO equity ownership between publicly traded firms and firms that had undergone a management buyout, this study is the only one to study the phenomenon on post-1990 buyouts.
When the housing market will stop falling?
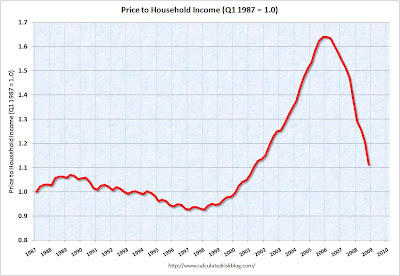
But the drop of price-to-rent ratio may be due to rising rents, as more people switched to rental in this depressing market. So we now look at price-to-income ratio. You actually find the similar story: historical average is at 1.0, now we are at 1.1. Almost there.

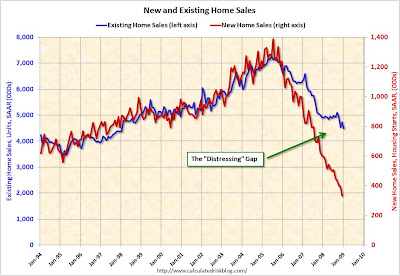
Looking at the same problem from a different angel: if we compare the existing home sales with new home sales— in the past, the two sales figures moved closely along with each other. But since early 2007, this relationship has diverged, with existing home sales trying to hold up and falling at a slower speed, while new home sales suffering almost a free fall.
Volcker: Capitalism will survive
Volcker, "This is mother of all financial crises…but capitalism will survive, although financial industry needs revisions".
A debate on bank nationalization
video link from Bloomberg.
Stiglitz on bank nationalization
or click the video link here


