World Bank reforms voting power structure
On April 25, the World Bank again restructured its voting share among countries. The new structure reflects the rising power of developing and transitional economies, especially China. Now the voting share is more aligned with country’s GDP share in the world.
China’s voting power was increased from 2.27% to 4.42%. The similar reform is also widely expected at IMF.
Here is a chart I made that compares country’s GDP share with their voting power at the World Bank.
link to the report on the reform.
update 1 ,
Bank of Finland has a nice chart similar to my table above, comparing GDP share with voting power for the top 12 countries.
(graph courtesy of Bank of Finland)
Feldstein: Greek default is a matter of time
Marty Feldstein thinks Greek default is inevitable. I think default is one possible outcome, and the alternative is for Greece to ask EU to be “kicked out” of European Union, so it can depeg itself from Euro zone and use monetary policy to stimulate its own economy.
Housing: rent or buy?
Housing, on a national level, has become much more affordable (see chart below). But housing market is always local. If you are not sure whether it’s a good time to buy vs. rent a house, you are not alone.
(graph courtesy of Northern Trust)
A yardstick to look at is the house-price/rent ratio – generally it’s good time to buy if the rent ratio is well below 20. Here is a list of rent ratios of major U.S. cities as of Q4 of 2009.
(click on the graph to enlarge; source: NYT)
Also , read this article from NYT, “In Sour Home Market, Buying Often Beats Renting“
Does SEC have a real case against Goldman?
Hear legal and investment experts on the issue:
China – bubble or no bubble?
China’s real estate bubble is of great concern to many people. Today, I want to entertain you with two contrast views on China’s real estate and housing market.
First group holds the view that China is experiencing no asset bubble in housing market, or, similar to Japan in 1970s, the sharp rising of housing price is a reflection of strong housing demands coming from high population density and rapid urbanization.
An example of this is a recent report from US Global Investors:
No Housing Bubble in China
By John Derrick, Director of Research
China’s housing market is hot, but it’s not a bubble on the verge of bursting, as many contend.
Before we can discuss why it’s not a bubble, a little background on the Chinese housing market is needed.
Prior to the early 1990s, urban dwellers in China were provided an apartment by their employers or the government, with rent set at less than 5 percent of their salary (utilities included). Starting in the early 1990s, the government began to privatize housing by selling apartments to their residents at a low price. Almost overnight it created a private home ownership rate of about 70 percent.
This policy change was also a vast redistribution of wealth from the government to the people – those apartments typically occupied prime downtown locations, and thus are worth at least the price of a new luxury apartment.
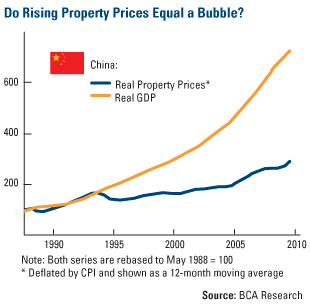
The price of housing in China has risen as the economy has expanded, but the chart from BCA Research shows that housing price growth has been significantly slower than GDP growth since the late 1980s.
The price of housing has roughly doubled since the late 1990s, but it’s important to remember that China’s prices have risen from a much lower base than in the developed countries (among them, Britain, Ireland and Spain) in which bubbles were created. It’s also relevant to point out that household disposable income in China more than doubled during the period. The rise of the Chinese middle class is a major global economic phenomenon – tens of millions of people are added each year.
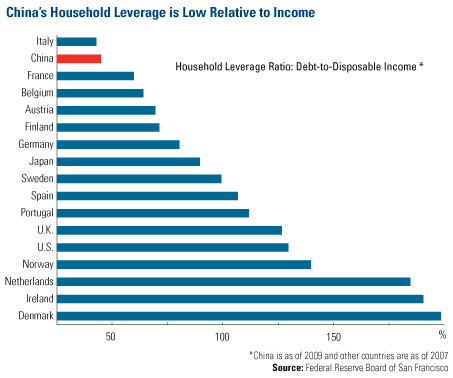
Leverage is also an important indicator in judging how susceptible a housing market is to growing into a bubble. The chart below, also from BCA Research, shows debt as a percentage of disposable income in China and in a number of developed-market countries. More than half of the developed countries had debt in excess of income, with Denmark and Ireland pushing 200 percent.
China is at the far other end, with debt totaling just 44 percent of disposable income.
Furthermore, homebuyers in China put down at least 20 percent as a down payment (30 percent for a first-time buyer and 40 percent for a second-home buyer to damp down speculation). These buyers rarely fall behind on their mortgage payments.It’s obviously true that there has been rapid price appreciation in major cities like Shanghai and Beijing. Prices have risen above the affordability level for most families in these cities, and that is why the government is acting to let some air out of those markets before dangerous bubbles form.
For example, the government’s “second mortgage rule” requiring much higher down payments is having some effect – in January, price appreciation rose less than 1 percent month-over-month, down from a 2.1 percent jump in December. The government has also ordered that developers build more economical homes.
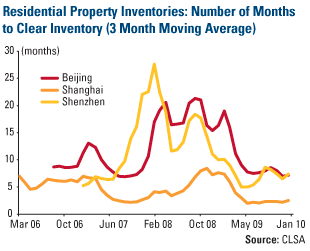
Where does the China housing market go from here? Home inventories are low in major cities – at the current sales pace, there are only a few months worth of inventory in Shanghai, and the situation isn’t much better in Beijing or Shenzhen (see chart below).
But demand is still strong. A recent survey by the Hong Kong-based brokerage CLSA found that 56 percent of China’s middle-class families are considering buying a new home – despite the higher prices many families can pay a 30 percent down payment because of their higher savings.
Our own research shows that property developers, coming off a good 2009, are expanding into second- and third-tier cities, where housing markets are also growing and prices are more affordable.
This widening of opportunity, combined with the government’s early recognition that decisive measures were needed, together will raise the probability that it will achieve its goal of slowing down home price increases without causing the market to collapse.
Another report comparing Japan and China from BoJ (Bank of Japan) also holds the similar view.
Here is the Chinese version and English version of the BoJ report. (h/t Yuki Masujima).
The other group, including myself, holds the view that China has a big real estate bubble waiting to burst. The only uncertainty is how big the impact will be.
I argued many times before that because China is at a much different development level than Japan was, thus with much higher growth potential, meanwhile China is still closed to free international capital flows, the damage of the bubble burst won’t affect China’s long-term growth projection, i.e., in China, there won’t be a lost decade similar to what happened in Japan and the U.S.
To demonstrate the key insights of the views for the second group, here I recommend two pieces:
1. NYT report on short seller Jim Chanos on his big bet against China.
2. In this Charlie Rose interview (one of my favorite shows), Jim Chanos elaborate why he’s shorting China, and what he’s been watching on China bubble.
This is a highly recommended piece,
(click to play in new window, about 30 mins)
Lowenstein: The future of Wall Street
Interview of Roger Lowenstein, author of “When Genius Failed: The Rise and Fall of Long-Term Capital Management” and “Buffett: The Making of an American Capitalist.”
Link to the interview, about 45 mins. A good history review of what went wrong.
New home sales up big time, but don’t get too excited
Sales of new homes increased 27% in March, the biggest monthly increase in 47 years. The sharp jump was largely due to the fact that the first-time home buyer credit program is going to expire on April 30.
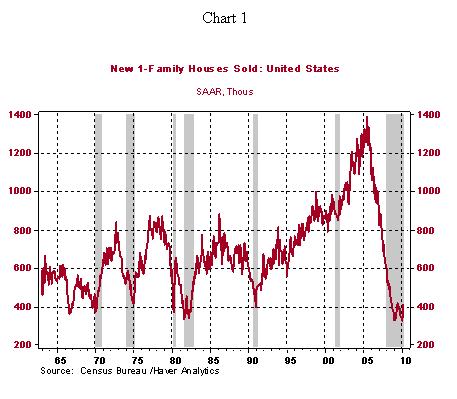
As seen in the chart below (graph courtesy of Northern Trust), the level of new home sales in March (411,000) still remains slightly below the July 2009 mark, or 70% below the peak recorded in July 2005.

Also watch this video interview of Mark Zandi, Chief Economist at Moody’s Economy.com, on the housing market outlook.


