

Is this normal correction, or another bear coming?
After yesterday's drop, the US market formally entered correction mode (defined by 10% decline from the recent peak). In finding out what's to come next, I pulled out my tool box.
The findings are quite surprising to me. All indicators seem to point out that there is something big coming. Because most of these indicators are coincidental indicators, so I can't be absolutely sure, but I would say that the risk is clearly on the down side.
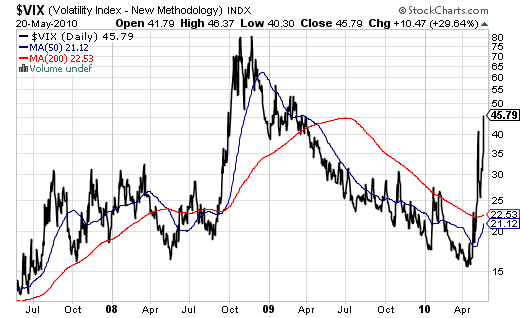
First, let's look at S&P 500 volatility index, or VIX – The sharp jump from teen-digit level in April to recent level of 45 really raised my eyebrows. I have been calling several market corrections since March 2009, but every time after a brief correction, the market turned back and resumed climbing up. The current VIX clearly broke such benign pattern – a very strong warning signal.
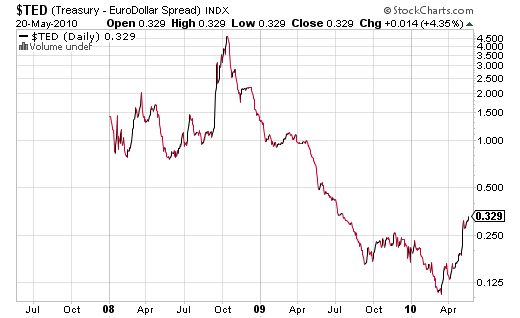
Now, let's turn to my favorite credit market indicator, the TED spread. Again the same pattern – the long declining trend since Lehman days clearly reversed direction. Because TED spread is calculated using Euro-LIBOR rate, the recent debt crisis in Europe certainly played a role. A rising TED spread signals tightening of credit markets. This won't be good for businesses (especially small businesses), the key to our nascent recovery.
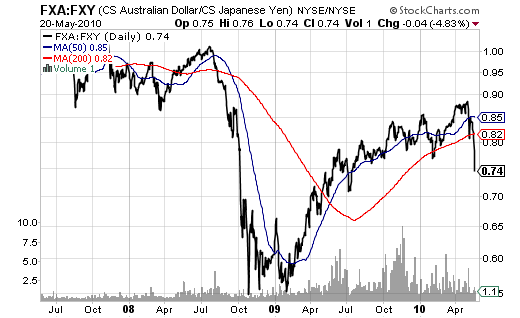
On the international front, let's look at two currency-cross indicators. First is the Aussie-Yen cross, which captures the carry trade using Japanese Yen to invest in commodities-driven economies, such as Australia and Brazil. Rising commodities currencies often signals strong economic growth or recovery ahead. The current big drop of Aussie-Yen cross indicates investors' lost of confidence for a robust of world economic recovery, especially considering China's recent clampdown of her domestic economy (housing market).
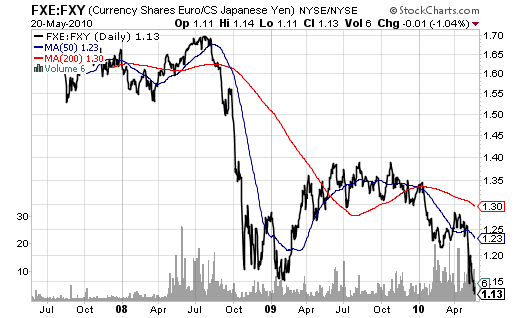
Second is the Euro-Yen cross, which is the most widely used gauge for carry trade sentiment. Again, the sharp decline of this indicator tells a story of panicking (of carry traders). In the past, the indicator is also a flight-to-quality indicator, i.e., investors scale back their risk appetite and seek for safe assets to hide.
Now, back to the question whether we are going into another bear market.
After a long climb since last March, the market (measured by SP 500 index) has risen an astonishing 82% (before recent correction) from the bottom level at 666. As as May 20, 2010, market P/E was still at 19.44, not cheap at all, compared to the long-term fair value P/E =16.4. (see graph below)

(click on the graph to enlarge)
Further, as shown in the following graph, historically, when the market falls from PE=21 level (the recent high), it at least goes down to PE=17, which means S&P 500 is likely go down to 936, at least.

(click on the graph to enlarge)
But a more careful look at the chart above, you would agree with me that recent crisis mirrors the period during the Great Depression most closely – first a big crash followed by a sharp rebound, then another big drop. The PE ratio in the second big drop during the Great Depression went from around 21 all the way to 12. If this were to happen again (I am not saying this will happen this time around), this would give S&P 500 level at 660, below the previous low (666).
You may argue this scenario is highly unlikely given the Fed's pumping money into the economy like crazy and today we have much better institutional setups compared to 1930s. But don't forget: we have one additional problem – that's the potential debt contagion from Greece and other PIIGS countries in Europe. So it doesn't hurt to take precautions.
In short, the risk is clearly on the down side. It's wise to scale back risky investments and hoard cash again, waiting for opportunities to come.
Comments are welcome.
Euro’s fall drags down commodities
Dollar's rise (Euro's fall) fueled the decline of commodities that are denominated in dollars, reports WSJ.
It is a simple relationship: As Europe's woes fuel the dollar's rise against the euro, dollar-denominated commodity prices fall.
But the malaise runs deeper. The euro zone consumed 10.5 million barrels of oil last year, according to the International Energy Agency. That was down 6% from 2008, but still more than China consumed, and 12% of global demand. Similarly, the euro zone consumes about 15% of the world's copper, much more than the U.S., according to the International Copper Study Group.
A weaker euro will do nothing to revive demand in the region. In dollar terms, oil and copper have fallen this year by 14% and 11%, respectively. In euros, oil is off by only 2%, while copper has risen slightly.

Compounding this is policy. While some might worry that quantitative easing will stoke inflation, the bigger proximate force is deflation, said Charles Dumas at Lombard Street Research, with austerity programs in countries like Greece and perennially tight German consumers. While the euro makes the zone's exports cheaper, its biggest market, the U.K., is weak.
The euro zone's drag extends to that great hope of commodities bulls everywhere: China. China exports as much to Europe as it does to the U.S. The euro's slide against the dollar-pegged yuan makes those imports more expensive at a time when Europeans are tightening their belts anyway. True, commodities are more affordable for China now, but its export markets are weak and Beijing is tightening monetary policy.
Euro-skeptics have long derided the idea of Europe as a major force. Commodities bulls, enduring big falls not just in spot prices but far out along the futures curve, must almost wish they were right.