

What yield curve tells us about the current economy
Inverted yield curve is a very powerful predictor for upcoming recession. I still remember vividly back in 2006, the yield curve was inverted, but the economy looked bright and robust. Alan Greenspan thought "this time is different", and hypothesized that the yield curves was inverted because of global savings glut, with Asian central bankers heavily buying US long-term treasuries – this phenomenon is the so called "Greenspan Conundrum". But eventually recession hit us in December 2007, and still we are not completely out of it.
So what the current yield curve tells us about the economy – analysis from WSJ:
There's no surefire way to forecast recessions. But watching the "yield curve" comes awfully close.
Essentially the difference between long term and short term U.S. government debt yields, the yield curve is a powerful harbinger of recessions and recoveries. Nearly every time the yield on short-term debt has surpassed the yield on long-term debt—what's known on Wall Street as an "inversion"—a recession has followed.
![[AOT]](https://sg.wsj.net/public/resources/images/MI-BF244_AOT_NS_20100815183216.gif)
Meanwhile, a "steep" yield curve, when long-term rates are much higher than short-term ones, usually augurs strong economic growth. Back in February, the difference in yields on the 10-year and two-year Treasury notes hit 2.929 percentage points—a record high. That also helped fuel the V-shaped rebound in the Conference Board's index of leading economic indicators. Little wonder investors felt good about recovery prospects at the time.
The yield curve has since flattened, but at about 2.16 percentage points it remains pretty steep by historical standards. That is a key reason why many economists still see a fairly small chance of a "double dip."
Yet some caution that the yield curve is distorted at the moment by the Federal Reserve's unusual degree of interference in the Treasury market. For example, by holding short-term rates near zero, the Fed has all but ruled out the possibility of an inversion. The yield curve "may not presently be an accurate signal," San Francisco Fed researchers said in a recent paper. Excluded from calculation of the Conference Board's index, they found, "generates far more pessimistic forecasts," which puts the odds of recession during the next two years above 50-50.
So if July's index of leading indicators, which includes the yield curve, posts a small gain as expected when the figures are released Thursday, investor reaction may be understandably muted. But they shouldn't ignore the yield curve altogether. After all, when the curve inverted back during the boom in late 2005, there were similar dismissals of its predictive power. At the time, it was said to be distorted by large-scale foreign purchases of U.S. government debt. Yet by December 2007, the economy was in recession.
What message then is in the yield curve fortune cookie? For now, it seems to be: dimmer recovery, but not quite lights out.
update 1. Yield curve dynamics
Watch this fantastic movie clip on how yield curve (to be more precise, the term structure of interest rates) evolved during the past few years. (ht: Jim Hamilton).
How different is the US from Japan?
A nice piece from WSJ compares how the current economic situation in the US is different from Japan during the same period after the big housing bubble burst:
By MICHAEL DARDA
Mr. Darda is the chief economist, chief market strategist and director of research for MKM Partners.
Despite record doses of monetary and fiscal support, the U.S. recovery appears to be stumbling. First-time claims for jobless benefits are on the rise and economic growth estimates for the April-June quarter have fallen to just over 1%. Many are now asking if we are on our way to a double-dip recession or even a Japanese-style "lost decade."
These concerns are not without merit. Although the Federal Reserve expanded its balance sheet massively in 2008-2009, most of the high-powered money (currency plus bank reserves) that it's provided has piled up as excess bank reserves on deposit at the Fed.
Growth in commercial bank credit and broad money (which consists of currency plus bank reserves plus deposits in the banking system) is decidedly weak. That's a reminder that interest-rate cuts and money printing don't have the same traction when households are debt- and savings-constrained, and financial institutions are uncertain about the value of the collateral underpinning their loans.
But there are key differences between where we are now and where Japan was 50 months after the 1990 peak in its real-estate market. These differences make it less likely that we'll succumb to a deflationary double-dip recession or a lost decade.
For example, industrial commodity prices are about 75% above comparable levels in Japan just over four years from the peak of its real-estate bubble, suggesting a lower risk of a deflationary slump here. Corporate profits in the U.S. are more than 50% above where earnings were at this point of the cycle in Japan, despite the fact that the S&P 500 is actually lower than the Nikkei 225 was at this point in Japan.
Although broad money is currently expanding slowly in the U.S., the level of the broad money stock is 20% higher here than it was in Japan 50 months from the peak in its real estate market. This gap owes to the more aggressive early efforts of the Fed as compared with the Bank of Japan.
Those concerned about a Japanese-style lost decade occurring here will point out that the Treasury yield-curve spread (the gap between long-term interest rates and short-term interest rates) is actually narrower in the U.S. now than it was in Japan 50 months from its real estate peak. This gap not only gives us a picture of monetary policy, it also tells us about the behavior of inflation expectations. The yield-curve spread actually widened after the Fed announced the planned purchases of $1.75 trillion in agency, mortgage and Treasury debt in early 2009, as deflation expectations were replaced with expectations for modest inflation.
But the yield-curve spread peaked in February 2010—the same month the level of the monetary base peaked—and has since narrowed sharply. Treasury Inflation Protected Security (TIPS) spreads have compressed during this period. These indicators suggest the need for the Fed to remain accommodative, as the Fed statement on Tuesday suggested would be the case.
The current economic situation looks like the first few years of economic recovery following the 1990-91 U.S. recession, which were also characterized by weak broad-money growth and a contraction in bank lending. The M2 money supply (a measure of broad money) expanded by only 1.4% per annum through 1994 from 1992, but the velocity of money (the frequency with which a unit of money circulates) turned higher, allowing real GDP growth to average 3.7% per year nonetheless.
Putting fiscal policy on a sustainable, pro-growth track may help reduce uncertainty and improve velocity now.
One problem that dogged Japan during its lost decade was a stop-and-go fiscal policy in which stimulus packages were administered in an "on again, off again" fashion and taxes were lowered and then raised. There is a risk that the U.S. could fall into this trap in an effort to strike a balance between short-term fiscal support and long-term budget integrity.
This strongly suggests that congressional leaders of both parties should embrace a pro-growth fiscal reform that would help to create long-run fiscal stability and foster certainty about future tax rates. With the 2001-2003 tax cuts set to expire at the end of 2010, the time is now to move ahead with broad-based reform.
A good starting point would be the bipartisan Wyden-Gregg tax reform bill. This bill is not incredibly bold, but is probably the best we could do in the current environment and is much better than the current tax code.
Wyden-Gregg would be revenue-neutral; it would simplify the tax code by reducing the number of personal income tax brackets to three from six and would do so without raising marginal income tax rates. The bill also would cut the top corporate tax rate to 24% from 35% in exchange for eliminating corporate tax loopholes.
This would surely be preferable to raising marginal tax rates at a time of high economic anxiety. Raising tax rates on capital, which will occur if the 2003 tax cuts expire at the end of this year, generally has not been an effective source of revenue for the Treasury and could do damage to the recent strong productivity trends the U.S. has enjoyed.
The most likely course for the U.S. economy from here is for a choppy recovery cycle to continue until households have increased their savings and reduced their financial obligations to sufficient levels and financial institutions have more confidence that loan losses have peaked.
Avoiding policy mistakes during this period will be critical. While the Fed is the ultimate source of liquidity and thus "demand," congressional leaders could help reduce uncertainty and increase confidence by embracing a bipartisan tax reform that focuses on broadening the tax base and preserving incentives for growth.
Where to invest?
Investment strategist at BNP Paribas, ‘entertains’ you with some good ideas:
How recession in debt deleveraging cycle different?
We’re in a time of unusual economic uncertainties.
David Rosenberg thinks, in the following video discussion, that this recession is fundamentally different from post-war recessions. The difference is this severe recession is coupled within a secular cycle of credit contraction.
While others think the US is in a subdued period of economic growth. Once unemployment starts getting better, and household gradually improves their balance sheets, with huge corporate cash piled up waiting to be invested, it’s a matter time that American economy will be back on track.
A lively discussion – don’t miss this one:
Demographics and Wealth of Nations
Following my previous post, “India needs manufacturing“, in which future population growth trend was analyzed, today I post another analysis from WSJ’s David Wessel on the relationship between demographics and nation’s wealth. Before that, I would like to give some background.
China’s huge population was long thought to be a development burden for the country. High population density puts all kinds of resources under pressure – water, energy, environment, traffic, etc. And if you take a static view, more population simply leads to lower living standards (if you measure living standards simply by GDP per capita). Simple math shows despite the fact that China is the second largest economy in the world (with total GDP 1/3 of the US), China’s GDP per capita is only 1/10 of the United States, as its population is 3 1/2 times larger.
China’s population surge during the second half of the 20th century was largely man-made. After 1949, when China’s Communist Party established People’s Republic, there was a big fear that the US may invade mainland China, along with the defeated Nationalist Party. During the era of conventional warfare, the size of army mattered. Chairman Mao, China’s paramount first-generation leader, encouraged every Chinese family to have more children – three, four, or even more. Such policy rendered probably the sharpest population growth in China’s modern history.
China’s policymakers soon realized they made a huge mistake. The immediate concern was how to feed the rising population when China was still in total blockage under Western Sanction (like today’s North Korea). The deliberation at the highest level then manufactured China’s unique “One Child Policy” (OCP), now worldly famous – which went into effect since mid 1970s, and got really tough since early 1980s. In urban China, OCP is strictly enforced; in rural China, it is more relaxed, especially when the first baby happens to be a girl.
Now after more than 30 years, Chinese policymakers had another problem – The rapidly shrinking young labor force. Over the past 30 years, China’s huge labor reserve (or cheap labor) has contributed a great deal to her fast economic growth. Ironically, once the growth engine started, population turned out to be a growth dividend, not a burden. China’s huge population also attracted tremendous foreign investments – who would not want a bite in the largest domestic market in the world?
But the ‘young’ developing China is forecast to face ageing problem much sooner than most countries at its development stage. To replenish population, the fertility rate should stay at least 2. Any rate below 2 means declining population (this assumes birth rate and death rate are roughly the same, but if people live longer, this will generate a larger share of older population). For thirty years, China’s fertility rate has only been slightly above 1. OCP effectively controlled China’s population growth, but also put China onto a “fast lane” toward ageing society.
Let’s get to details: One-Child Policy started roughly around 1980, so the first cohort of young population (about 20 years old) entered labor force around year 2000, that’s when China suffered its first dent on labor force. It’s no coincidence that during the same time various reports surfaced that manufacturing firms in China’s east coast started to feel labor shortage, defying the popular image that China seemed to have unlimited labor supply. The shrinking labor supply will become more severe when the last large cohort of population born right before OCP exits the manufacturing. I assume this is going to happen from now to the next five years (2010-2015), when most of these workers reach their middle-age (35 to 40). With more working experiences and skills, especially, the migrant workers in this group will seek more stable income and better location with equal social benefits. This often means exits from coastal manufacturing.
China’s young labor force will continue to shrink until 20 years after the major policy reversal. The policy reversal now in effect is to allow qualified couples to have up to two children, if both husband and wife are the only child in their own families. Let’s assume these couples will have their children between 25 and 35 years old (or between year 2005 to 2015 for the first cohort). Only when their children grow old enough to join labor force, i.e, when they become abut 20 years old (or between 2025 and 2035), will China’s young labor force start to grow again. This simply means within roughly a 30-year range, from 2000 to 2030, China’s young labor force will continuously trend downward. For a country still at its early development stage, this forecast should sound high alert to policy makers.
If you want to know about the role of population in country’s growth and development, feel free to download my lecture notes on the population theory. Economist Magazine also has a terrific article, “Does Population Matter?”
Now without further adieu, I introduce you to David Wessel’s analysis on the “Demographics and Nation’s Wealth“. Pay special attention to the US’ future demographic trend, and what can we learn from it.
Demography is not destiny. In 1300, China was bigger than Europe and had the world’s most sophisticated technology. But China blew it. By 1850, its population was 65% larger than Europe’s, but—thanks to the Industrial Revolution—Europeans were far richer.
Yet demography does matter. “We never pay enough attention to demography because it’s so long term,” says Dominique Strauss-Kahn, head of the International Monetary Fund. So turn for a moment from angst about the disappointing pace of the economic recovery and daunting government budget deficits, and look over the horizon.
Over the next 40 years, Japan and Europe will see working-age populations shrink by 30 million and 37 million, respectively, according to United Nations projections. Birth rates are low and so many of their people are already elderly.
![[Capital]](https://sg.wsj.net/public/resources/images/NA-BH438_Capita_NS_20100811192813.gif)
China’s working-age population will keep growing for 15 years or so, then turn down, the result of its one-child policy and the tendency of birth rates to fall as incomes rise. In 2050, the U.N. projects, China will have 100 million fewer workers than it does today. India’s population, in contrast, will grow by 300 million working-age persons over the next 40 years.
The U.S. is in between, benefiting from a higher birth rate and younger populations than Europe and Japan and more immigration. It is projected to add 35 million working-age persons by 2050.
So what?
History, as interpreted by modern economists pondering the mysteries of growth, teaches that more people lead to more ideas. And unlike land or oil, ideas can be used by more than one person simultaneously. Before countries began sharing ideas, the biggest had the most rapid technological progress. Now, trade, travel and the Internet speed new ideas around the globe ever-more rapidly. So the benefits are dispersed. Belgium is rich not because it is big or has invented a lot, but because it has the wherewithal to employ technology invented by others, notes Michael Kremer of Harvard University. Zaire is bigger, but lacks the wherewithal.
…
“China’s population is roughly equal to that of the U.S., Europe and Japan combined,” optimistic Stanford University economists Chad Jones and Paul Romer observed recently in an academic journal. “Over the next several decades, the continued economic development of China might plausibly double the number of researchers throughout the world pushing forward the technological frontier. What effect will this have on incomes in countries that share ideas with China in the long run?” Somewhere between a lot and really a lot, they say. In fact, they say that even if the U.S. had to bear all the costs of mitigating the added carbon emitted by a rapidly developing China, ideas generated by the Chinese would boost U.S. per capita income enough to more than compensate.
…
For China, the challenge is to build social structures and retirement schemes to sustain a growing cadre of old folks that, unlike previous generations, won’t be able to rely so much on its children for support. Today, 1.4% of Chinese are over age 80; in 2050, 7.2% will be, the U.N. projects.
…
And the U.S.? For all today’s gloom, it may be in the sweet spot. A growing population, an openness to ambitious immigrants and trade (if not disrupted by xenophobic politics) and strong productivity growth (if sustained) could lift living standards and bring faster growth, which would reduce big government budget deficits far easier for the U.S. than for slower growing Europe and Japan.
The Rise of Permabears
The talk of deflation itself may serve as a self-fulfilling prophecy. NYT reports the pessimism toward the US economy now became "fashionable" among mainstream economists and investors – call it "the rise of permabears".
We may all lose our spectacles.
Why NBER hasn’t declared “recession is over”
David Rosenberg explains why:
There are two other critical factors preventing NBER from declaring the all-clear signal.
First, despite the dramatic rebound in the equity market in 2009, personal income fell in 49 of the 52 U.S. cities of a million population or more. The three cities that saw an increase were closely tied to the federal government (like Washington D.C.). Indeed, government pay managed to rise 2.6% last year while all the suckers that work in the private sector posted a 6% wage decline. How this doesn’t breed dissent is a legitimate question.
Second (…) is the rapid decline in the employment-to-population ratio. This is a far more informative measure regarding labour market performance than the traditional unemployment rate, especially at a time when discouraged workers are withdrawing from the labour force at such an alarming clip.
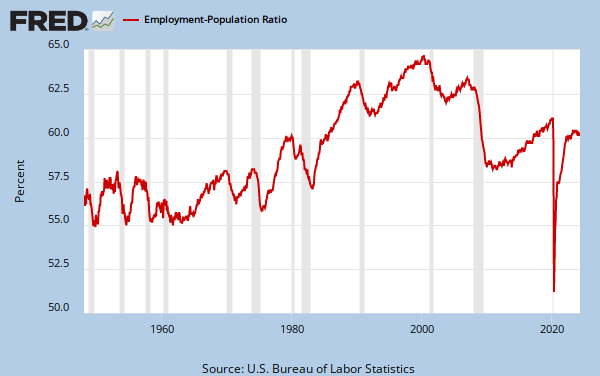
The employment rate has declined now for three months in a row, back to where it was at the start of the year, and smartalecks who see this recovery as anything but disturbing don’t realize that this employment rate, at 58.4%, is down from 64.0% at the 2007 high. This was the largest drop in the post-war era and what it means is that the economy is 12 million jobs shy of being at full employment.
Instead of declaring an outright war on unemployment, we instead have a government bent on measures to boost spending on cars and homes that nobody really wants since, at the margin, all people want to do is boost their once-depleted savings rates and get out of debt; or at least a half dozen housing plans to help distressed mortgage borrowers. Or infrastructure spending that so far seems to have helped line the pockets of public sector union officials with no obvious payback in terms of job creation. At least FDR paid people to work, even if it meant skyscrapers, bridges, monuments and national parks. They didn’t get paid do sit idle for 99 weeks so they can then drop out of the labour force and into oblivion (almost 45% of the unemployed have been so for more than 26 weeks — in no other recession in the past six decades did this share ever cross above 26%).
Almost half of the ranks of the unemployed have been looking for a job fruitlessly for at least six months. Let’s get these people re-engaged in the labour market, get them re-tooled and retrained for the skill set that businesses need now and in the future. Give these folks a shovel from 8 to 12 and engineering courses from 1 to 5 in return for their jobless insurance check. It’s time to get creative and aggressive with minimal cost to the taxpayer. If we can win this fight against unemployment, it’s amazing what other positive things will fall into place, from housing demand to government revenues to consumer credit quality.