

Digest latest GDP number
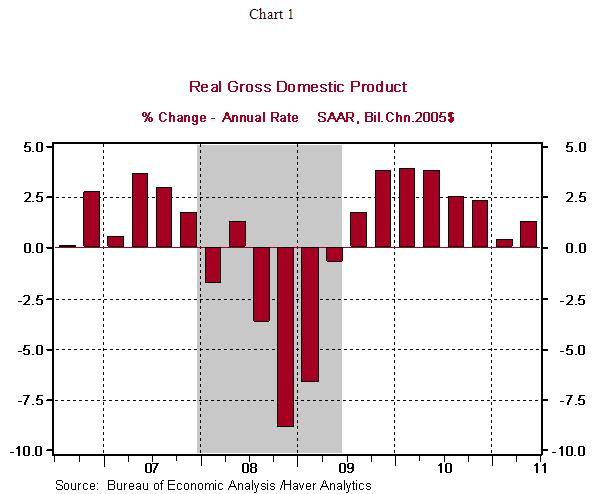
Real GDP in Q2 2011 is estimated to grow at only 1.3% annualized rate, while Q1 GDP growth was significantly revised down from 1.9% to mere 0.4%. This was achieved despite the Fed’s two rounds of quantitative easing.
The recovery of the US economy seems having lost its momentum. Here is a chart from Nothern Trust’s research team.
So far, the recovery since summer 2009 has failed to pull the US economy back to its pre-peak level achieved in late 2007 (see this nice graph from calculatedrisk, click to enlarge).

John Silvia, chief economist at Wells Fargo, describes the latest growth number as the “worst of all worlds”. And he is worried that the inflation in the US is creeping up in the face of high unemployment – you know where we are heading, do you?
Long-term unemployment
According to Labor Dept., in 2010 on a national level, a little over 25% of the unemployed had been out of job for over 52 weeks. In New Jersey, Georgia, Michigan, South Carolina, North Carolina, Illinois and Florida, more than a third of unemployed residents had been out of work for at least a year. New Jersey was the worst among the worst bunch: 37.1% of the jobless had been out of work for at least a year.
WSJ also has a nice interactive chart of long-term jobless rate by each state (link). You will notice, even in Texas, a state with one of the strongest economies, over 20% of the unemployed had been out of work for a year.
Here below is a chart from CalculatedRisk that tracks the long-term unemployment (for more than 26 weeks, or half a year) since 1960s. I don't need to say a thing – you immediately see how serious the problem is.
We are heading into another 70s – the only difference is we have yet to see high inflation – just not yet.

Gold passing $1,600 – but don’t sell yet
In an era when US dollar, Euro, and Yen are competing for 'which is the worst currency', and when emerging markets are suffering from high inflation and asset bubbles, hold on to your gold.
Long-term investors should not worry about the ups and downs in the short term. Until real interest rate turns positive, don't sell.
Here are a couple of very nice charts from Dr. Yardeni. Click to enlarge.
It's the extraordinary time that makes investing so exciting…
How governments use financial repression to pay down their debt
Economist Magazine recently had a fantastic article on the history of how government could use 'financial repression' to pay down their debt. Here below are my summary and some highlights. You certainly will see some of the same gimmicks will be repeated during this debt liquidation process.
To pay down government debt, essentially, there are 3+1 ways:
1) Grow out of it, with income from economic growth being subtracted by interest rate payments. As long as the income is greater than interest payment, this will work out;
2) Tax out of it – this requires some real sacrifice of the country and its countrymen. Ironically, higher tax often inhibits faster economic growth, especially when the economy is already quite weak, so most economists will probably advise against it. Higher tax is also not very helpful in controlling government spending;
3) Inflate out of it – the easiest way, and a no-brainer, and governments have been using it all along human history. But it comes with long-term dire consequences. For one, the government may ruin its reputation as a debtor. People, both domestic and foreign, will be less willing to lend in the future, if ever again at all.
In the case of the United States, since a lot of government debts are held by foreigners, it's even easier to let foreigners foot the bill by printing money, as long as the whole international financial system, based on the US dollar, won't collapse (the bet is Chinese and Japanese are stuck into 'dollar trap' – they have no choices, so inflate while you still can). The long-term consequence is US dollar loses its status as international reserve currency. Some sort of new international monetary system will eventually emerge.
4) Lastly, the 4th way – rolling over into new debt with lower interest rate. This is often combined with an inflation rate that is higher than the nominal interest rate. With real interest rate being negative, government essentially solves its liquidity problem by financing its borrowing through lower interest and reduces its debt load through inflation.
Now, the excerpts from Economist:
Following the second world war many countries reduced debt quickly without messy defaults or painful austerity. British debt declined from 216% of GDP in 1945 to 138% ten years later, for example. In the five years to 2016, by contrast, British debt as a proportion of GDP is expected to drop by just three percentage points despite a harsh austerity programme. Why was it so much easier to cut debt in the immediate aftermath of the war?
Inflation helped. Between 1945 and 1980 negative real interest rates ate away at government debt. Savers deposited money in banks which lent to governments at interest rates below the level of inflation. The government then repaid savers with money that bought less than the amount originally lent. Savers took a real, inflation-adjusted loss, which corresponded to an improvement in the government’s balance-sheet. The mystery is why savers accepted crummy returns over long periods.
The key ingredient in the mix, according to research by Carmen Reinhart of the Peterson Institute for International Economics and Belen Sbrancia of the University of Maryland, was “financial repression”. The term was first coined in the 1970s to disparage growth-inhibiting policies in emerging markets but the two economists apply it to rules that were common across the post-war rich world and that created captive domestic markets for government debt.
…
Repression delivered impressive returns. In the average “liquidation year” in which real rates were negative, Britain and America reduced their debt by between 3% and 4% of GDP. Other countries, like Italy and Australia, enjoyed annual liquidation rates above 5%. The effect over a decade was large. From 1945 to 1955, the authors estimate that repression reduced America’s debt load by 50 percentage points, from 116% to 66% of GDP. Negative real interest rates were worth tax revenues equivalent to 6.3% of GDP per year. That would be enough to move America’s budget to surplus by 2013 without any new austerity programme.
Cafes as Innovation Incubator
Cafe as meeting place for ideas and many billion-dollar dreams.
Which emerging market is overheating?
Economist Magazine constructs a nice overheating index for emerging markets. The index includes six macro factors: inflation, output gap, unemployment, excessive credit expansion, real interest rate, and current account.

According to the index, the most overheated emerging market is Argentina, and it is followed by Brazil, India, Indonesia, Turkey and Vietnam.
China lies in the mid of the pack – given China’s recent wave of tightening, the risk is low for China, IMO.
For details of ranking for each factor, use link here.
QE3 is coming – some investment strategies
It’s summer 2010, deja vu. QE2 ended in June, economy hasn’t gotten any better, and labor market remains bleak. People (including Fed Chairman Bernanke) started to talk about another round of quantitative easing. He immediately took back all his words the next day. The market gyrated.
For QE3 doubters, now look back to listen again these predictions a few months ago, for example, Marc Faber. Well, if you ask me, who am I willing to believe, Bernanke or Marc Faber? I would vouch for the latter – why should I pick someone who continues to disappoint? – the cry-wolf.
QE3 will eventually arrive, but don’t wait until the actual announcement to adjust your portfolio. Why? QE2 finally arrived in Nov. of 2010. But all the asset appreciations, including Treasuries, took off much earlier around April-May, when the speculations began to circulate. Now is your best time to reposition your portfolio.
The Fed will print more money to support bonds and treasuries. Then they will resort to inflation to pay down government debt. Chinese and Japanese will cry foul again. But as small investors, the easiest way to profit from this is to long long-term bonds, which tend to appreciate much more than their short-term cousins. Buying bonds sounds really silly when the yields are at historically low. But the bond bubble simply is not willing to pop, not yet. Everybody has been betting the yields will only go up, but what if we are headed for a long slog? And Bernanke Co. seems so willing to use whatever they have to prevent another Japan.
Okay, all these are good for bonds and bad for the dollar.
The US dollar will continue to depreciate, especially against those resource/commodity currencies, such as Brazilian Real and Australian Dollar. These currencies tend to move closely with emerging markets, which triple the growth rate in the developed world. Australian dollar surged over 50% since 2008-9 low, and as safe haven, Swiss Francs has appreciated nearly 50% – I personally felt the pinch when I traveled to the Switzerland last month. The same logic applies to gold. Gold will continue its rally. Don’t think gold is near its peak at $1,600. Wait until you see QE3.
Just a few of thoughts here. Wait until next time…
A tale of two recoveries
In 2009, there was a heated debate with regard to how strong the recovery will be. There were many guesses: L-shaped, V-shaped, you name it; the funniest one was a "root-square" recovery, meaning an initial rebound then followed by anemic growth, or the economy goes sideways. Now in hindsight, this seemingly funny root-sq analogy is probably the most accurate way to describe the current state of the recovery.
John Taylor compares the current recovery to the one after the deep recession in 1981-82. See the graph below. A real V-shaped recovery would mean GDP growth in the range of 7-8%. 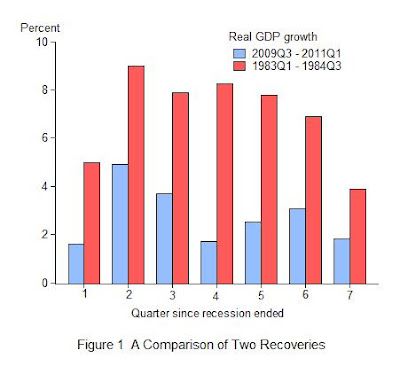
The current recession-recovery also invalidates Milton Friedman's famous hypothesis that the deeper recession is, the stronger the recovery will be — the so-called "plucking" model.
I am deeply troubled by Bernanke's recent talk that QE3 may be in the pipeline. If QE2 has no effect at all, why bother with another round of QE? This is an exciting time for economists to come up with new theories. I personally think the most promising area is to integrate financial market (esp. credit boom and bust) with the real economy. The traditional approach seems to believe there is a clear separation between the two.