Credit contraction
Two fascinating charts (click to enlarge) from David Rosenberg.
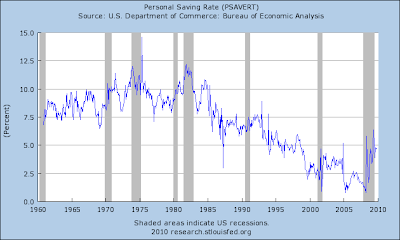
This historical credit contraction should give pause to the argument for sharp economic recovery. The contraction is a result of both banks’ unwillingness to lend and consumers’ caution toward consumption on credit. This, not surprisingly, coincides with rising personal saving rate.
Also report from WSJ:
U.S. consumers in November reduced borrowing by the most on record, cutting credit card use by nearly 20% even as the economy recovers.
Consumer credit outstanding decreased at a seasonally adjusted annual rate of 8.5% to $2.465 trillion.
The $17.5 billion tumble is the largest since the Fed began keeping records in 1943.
Economists surveyed by Dow Jones Newswires had forecast a $6 billion drop in consumer credit. It was the 10th drop in a row. Consumer credit fell $4.2 billion in October.
Household debt began dropping in the summer of 2008. The financial crisis struck and sparked panic, startling people into taking a serious look at their balance sheets.
While weaning oneself off debt is considered good from a personal finance viewpoint, widespread deleveraging among U.S. households has reduced spending, an omen for the economy.
Consumer spending makes up two-thirds of gross domestic product, the measure of economic activity. Their spending needs to grow for the economy to recover into 2010. But some banks are making it hard for people to get loans. And the job market hasn’t healed; data Friday showed payrolls fell in December, even more than expected.
Retail sales rose strongly in October and November. The Fed report Friday suggested people are dipping into savings to support their spending. Revolving credit, or credit-card use, fell by $13.7 billion to $874.0 billion. That was a record 14th straight drop. At 18.5%, the fall was the biggest since December 1974. Credit-card use fell 9.9% in October and 10.5% in September.
Non-revolving credit, including automobile and mobile home loans, decreased in November by 2.9%, or $3.8 billion, to $1.591 trillion.
The consumer-credit data exclude home mortgages and other real estate-secured loans. These tend to be highly volatile from month to month and are frequently revised. But the report still has interesting details on how Americans finance their lifestyles.
Washington, we might have a problem
The world economy is on a recovery track. But every time I read this graph (or similar ones) below, it makes me feel very uneasy.
Stare at this graph for a minute, you will immediately tell what might be the problem: every time after a big market crash, the relative valuation metric (PE ratio) touched the extreme on the downside. You may call it “overshoot on the downside”. But not this time.
Government and central bank succeeded in avoiding an armageddon scenario, but does it only postpone the inevitable? I am still posing the question, whether we will be headed into a long secular bear market.
Bubble warning
Economist magazine warns against asset bubble, especially in emerging markets.

THE effect of free money is remarkable. A year ago investors were panicking and there was talk of another Depression. Now the MSCI world index of global share prices is more than 70% higher than its low in March 2009. That’s largely thanks to interest rates of 1% or less in America, Japan, Britain and the euro zone, which have persuaded investors to take their money out of cash and to buy risky assets.
For all the panic last year, asset values never quite reached the lows that marked other bear-market bottoms, and now the rally has made several markets look pricey again. In the American housing market, where the crisis started, homes are priced at around fair value on the basis of rental yields, but they are overvalued by almost 30% in Britain and by 50% in Australia, Hong Kong and Spain.
Stockmarkets are still shy of their record peaks in most countries. The American market is around 25% below the level it reached in 2007. But it is still nearly 50% overvalued on the best long-term measure, which adjusts profits to allow for the economic cycle, and is on a par with two of the four great valuation peaks in the 20th century, in 1901 and 1966.
Central banks see these market rallies as a welcome side- effect of their policies. In 2008, falling markets caused a vicious circle of debt defaults and fire sales by investors, pushing asset prices down even further. The market rebound was necessary to stabilise economies last year, but now there is a danger that bubbles are being created.
December employment update
The most recent job picture from NYT. It looks like some people's hope that employment will have a sharp recovery was temporarily put on hold.
Start to feel inflation in China
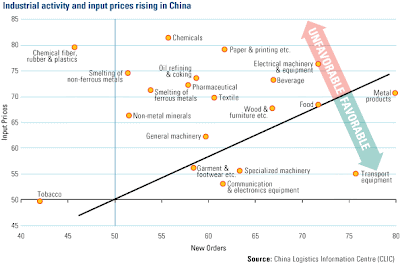
China’s central bank raised it’s inter-bank lending rate, showing worries about inflation pressure in the economy. The graph below from new order PMI clearly demonstrates the pressure has built up in most sectors.
One of the areas of concern in China’s PMI report was the rise of input prices by 3.3 points to 66.7. This is an indicator of rising inflationary pressures. This, coupled with the rise in food prices, should be monitored closely in the coming months.
Stock market reform in China
The long anticipated stock index future, margin and short selling were just approved by China's regulators. It is yet clear when these new investment vehicles will be officially introduced to the market. This is a big development. Reports Bloomberg.
Job Perspective of America’s Lost Decade
I posted a little while ago on America’s lost decade in terms of investment returns (also this post), here below is a nice graph summarizing job creation by decade: The past decade was clearly a lost decade in job creation. Also read my previous post on this here.
China’s pollution in comparative perspective
China is heavily polluted. You will immediately know that by just looking at the sky of Chinese cities. But sky-looking can be deceptive. This NBER research offers some startling evidence on how China's CO2 emissions compare to the US.
The Greenness of China: Household Carbon Dioxide Emissions and Urban Development
NBER Working Paper No. 15621
China urbanization is associated with both increases in per-capita income and greenhouse gas emissions. This paper uses micro data to rank 74 major Chinese cities with respect to their household carbon footprint. We find that the “greenest” cities based on this criterion are Huaian and Suqian while the “dirtiest” cities are Daqing and Mudanjiang. Even in the dirtiest city (Daqing), a standardized household produces only one-fifth of that in America’s greenest city (San Diego). We find that the average January temperature is strongly negatively correlated with a city’s household carbon footprint, which suggests that current regional economic development policies that bolster the growth of China’s northeastern cities are likely to increase emissions. We use our city specific income elasticity estimates to predict the growth of carbon emissions in China’s cities.


![Reblog this post [with Zemanta]](https://img.zemanta.com/reblog_e.png?x-id=1a1362b2-dbbf-4d56-82d8-c375c02a1fa1)


![Reblog this post [with Zemanta]](https://img.zemanta.com/reblog_e.png?x-id=bb7b20c9-aa29-4579-9edc-8669f4b8c7e7)
