State budget shortfall
According to WSJ:
This is the worst time to raise taxes.

+++Watch closely: Initial jobless claims+++
Bob Gordon, one of the leading macroeconomists in the US pointed out his observation on the Wall Street Journal a few weeks ago:
He points to one indicator in particular with a remarkable track record: the number of Americans filing new claims for unemployment benefits. In past recessions, it has hit its peak about four weeks before the economy hit a trough and began to grow again. As of right now, the four-week average of new claims hit its peak of 650,000 in the week ended March 14. Based on the model, “if there’s no further rise, we’re looking at a trough coming in April or May,” he said, which is far earlier than most forecasts currently anticipate.
Jim Hamilton at UCSD verifies Gordon’s observation on a graph:

(click to enlarge; courtesy of Hamilton)
The graph above plots 4-week averages of the initial unemployment claims going back to 1967, with vertical lines drawn at the first week of the month in which the NBER eventually declared that a recovery from the recession began. Gordon’s relation is indeed pretty striking– in each of the last six recessions, the recovery began within 8 weeks of the peak in new unemployment claims.
MIT panel on financial crisis
Last week, I attended a panel discussion at MIT, “The US Financial Crisis: Is there an end in sight?”. This was version 2 of an earlier panel discussion in the fall.
Nothing more than a bear market rally
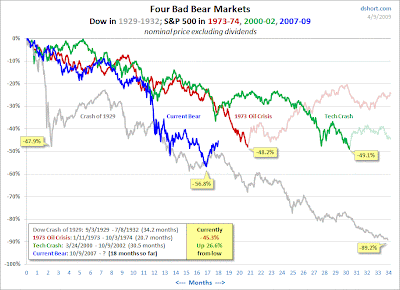
I think this is just another bear market rally. But I was a little surprised by how strongly the market has reacted to the unconfirmed evidence that the market is turning the corner. One common mistake people have is that slower pace of contraction does not mean we will have a quick recovery; the economy will remain weak for a long time. Yes, that’s how I look at it.
Now, watch how market strategists think about the recent strong rally.
David Rosenberg, former Chief Economist at Merrill Lynch, is not so enthusiastic about recent rally, either:
Currently, the equity market is priced for $70 on earnings on a going-forward basis, or a 75% rebound. And with retailing stocks up 30%, leisure/accommodation up 35%, and the homebuilders up 40%, the market is priced, amazingly, for a revival that is led by the consumer! (in fact, the only S&P sector that is now trading at P/E multiples that are at post-2001 highs is the consumer cyclical group). If we see that in the next year, we will be the first to hang up our Hewlett Packards. Being up 25% in a year and staying bearish … well, shame.
Achieving that in less than a month – come on. Too flashy for our liking.
In fact, let’s learn from history. The only times we have ever seen the stock market surge close to this much in such a short time frame were:
* December 1929
* June 1931
* August 1932
* May 1933
* July 1938
* September 1982
Only in September 1982 and in May 1933 was the equity market embarking on a new bull phase. But guess what? By the time the S&P 500 surged 25%, it had already crossed above its 200-day moving average. So call us when the S&P 500 crosses the 1,000 mark – another 20% to go. That is how deeply entrenched this particular bear market has been – that even after this massive rally, the onus is still on the bulls! Consider as well that on 4 of the 6 occasions that the equity market staged such a huge rally over such a short time period, it relapsed. So we are going to wait this out, acknowledging that we could be late to the party. We still feel the downside risks are too high to be involved.
Berner: "Scattered sign of improvement"
Interview of Richard Berner, Chief Economist of Morgan Stanley, on the economic outlook.


